REPORT
Global Threat Landscape Report 2026: The Ransomware Extortion Economy
Public incident intelligence, corroborated with backup-layer telemetry and real recovery cases detailing attackers, targets, what slips through, and what recovery requires.
Content
Content
Executive Summary
Public incident intelligence, corroborated with backup-layer telemetry and real recovery cases detailing who is attacking, who is being hit, what slips through, and what recovery takes.
0
publicly reported incidents analysed
0
ransomware groups active in 2026
0%
of active groups seen in backup telemetry
About this report: Three lenses. One threat.
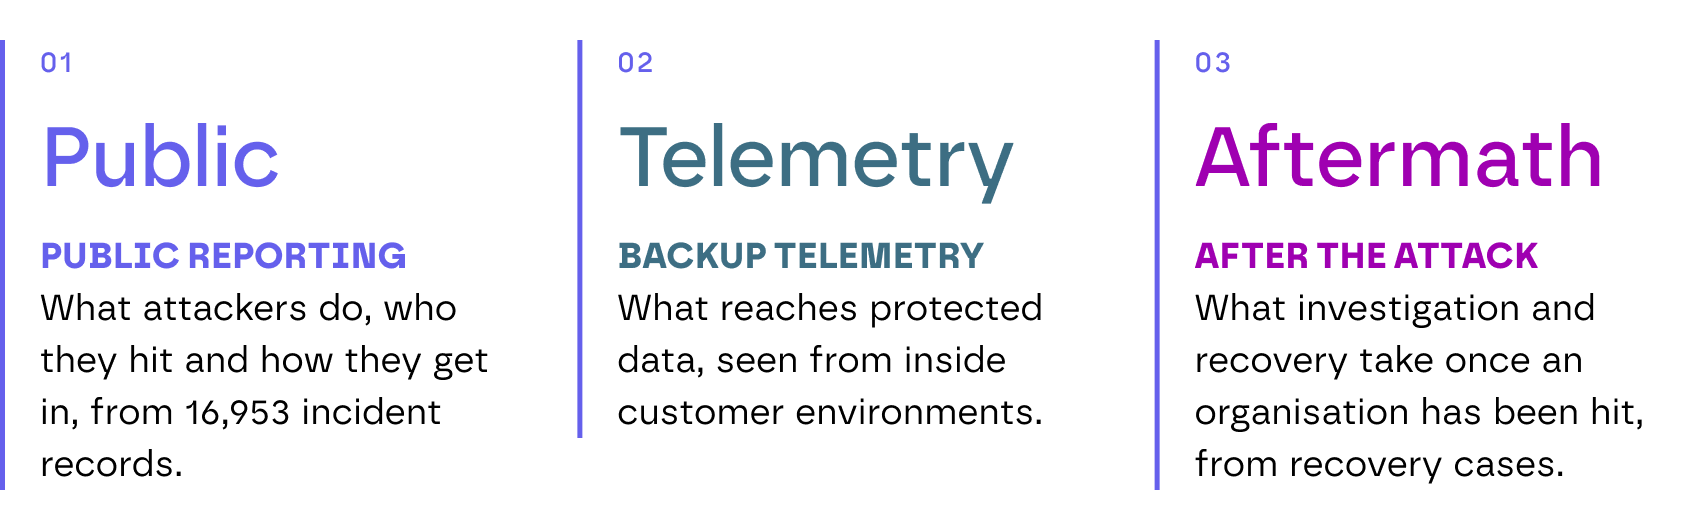
This report combines three independent views of ransomware in 2026.
- Public reporting: 16,953 publicly reported incidents from January to October, covering 100 individually vetted groups.
- Backup telemetry: ransomware detections found inside customer environments, which shows what has already passed frontline defences.
- After the attack: ransomware recovery engagements handled in 2026, where impacted organisations requested help restoring business functions, which shows what recovery actually takes.
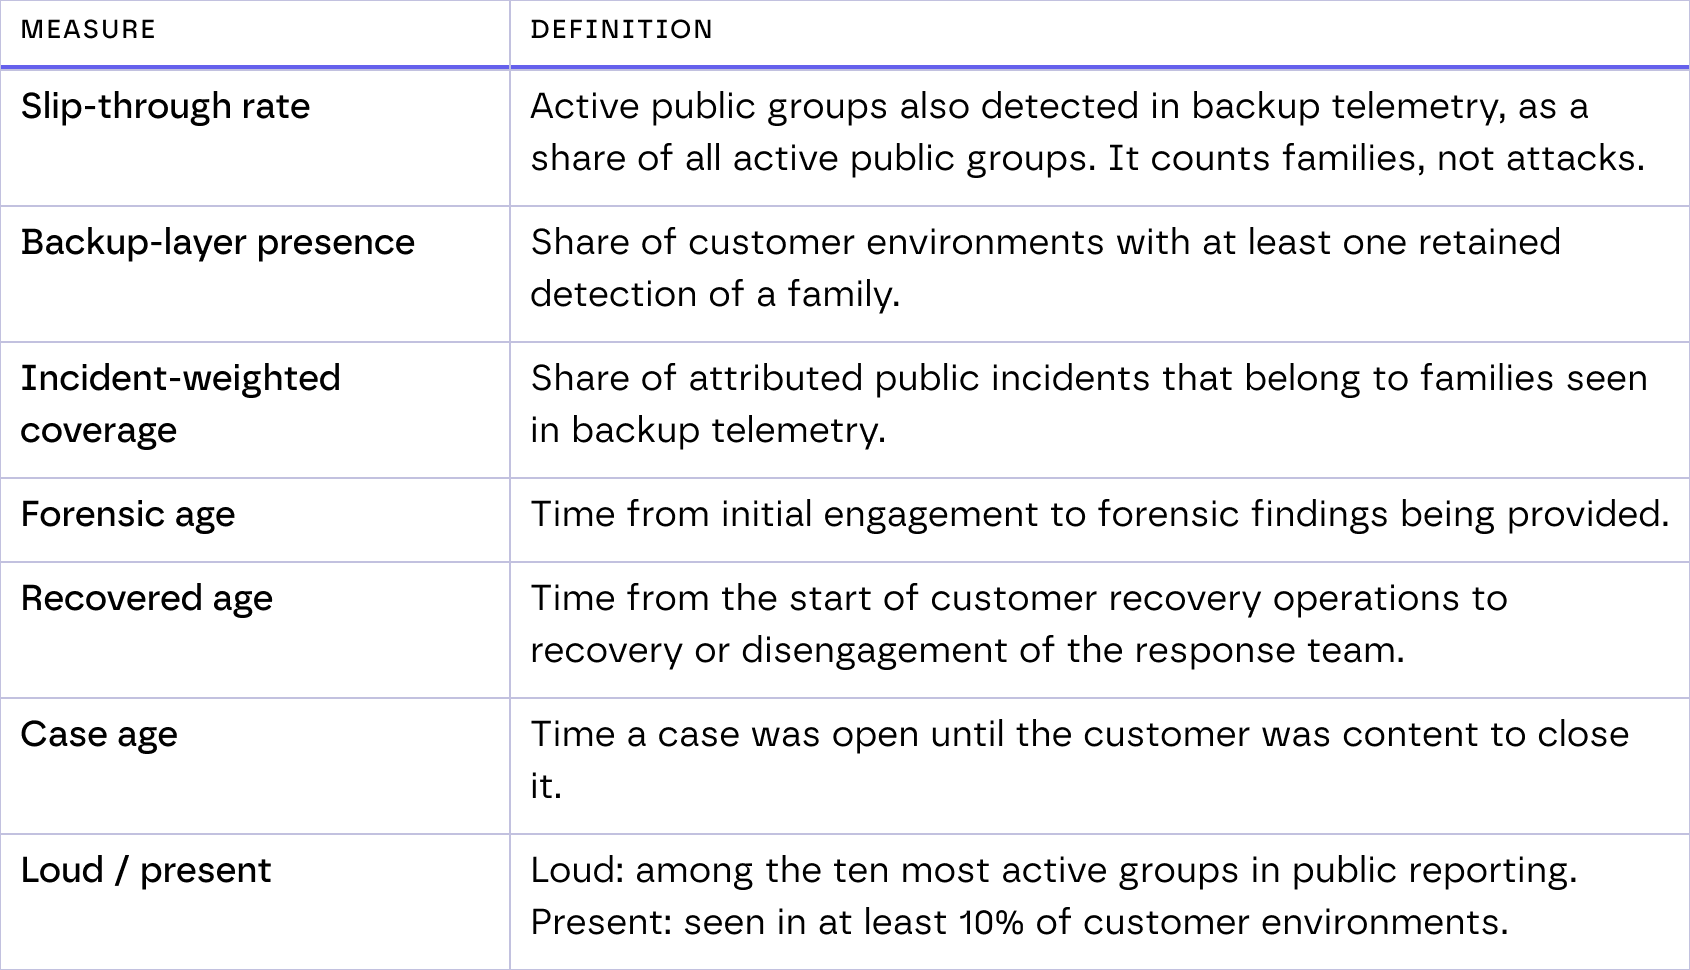
Each chart is tagged with the source view, with overlapping cases explicitly noted. Public reports were de-duplicated, Standardized and checked against independent reporting. Telemetry and recovery case data were cleaned conservatively, with suspected false positives removed. Percentages describe incidents or recovery cases where a detail is stated. Medians are used for times. Definitions and data notes can be found in Appendix B.
In this report
Executive summary: The year in numbers and seven findings
Chapter 1 - The attackers: Which groups drive activity, and which reach customers
Chapter 2 - The playbook: Tactics, entry points and attacks on recovery
Chapter 3 - The victims: Sectors and geography
Chapter 4 - What gets through, and what it costs: Telemetry, slip-through rate and recovery time
What to do: Five moves and key facts
Appendices: Group table, data notes and definitions
The year in numbers
Ransomware in 2026 is a data-theft business run by a small core of groups with much of the cost accrued during recovery. Seen through all three lenses, the pattern is consistent: groups that dominate public reporting are the ones reaching backup environments, and recovery takes weeks rather than days.
Key findings
Chapter 01 | The attackers: Eight groups drive half of the activity
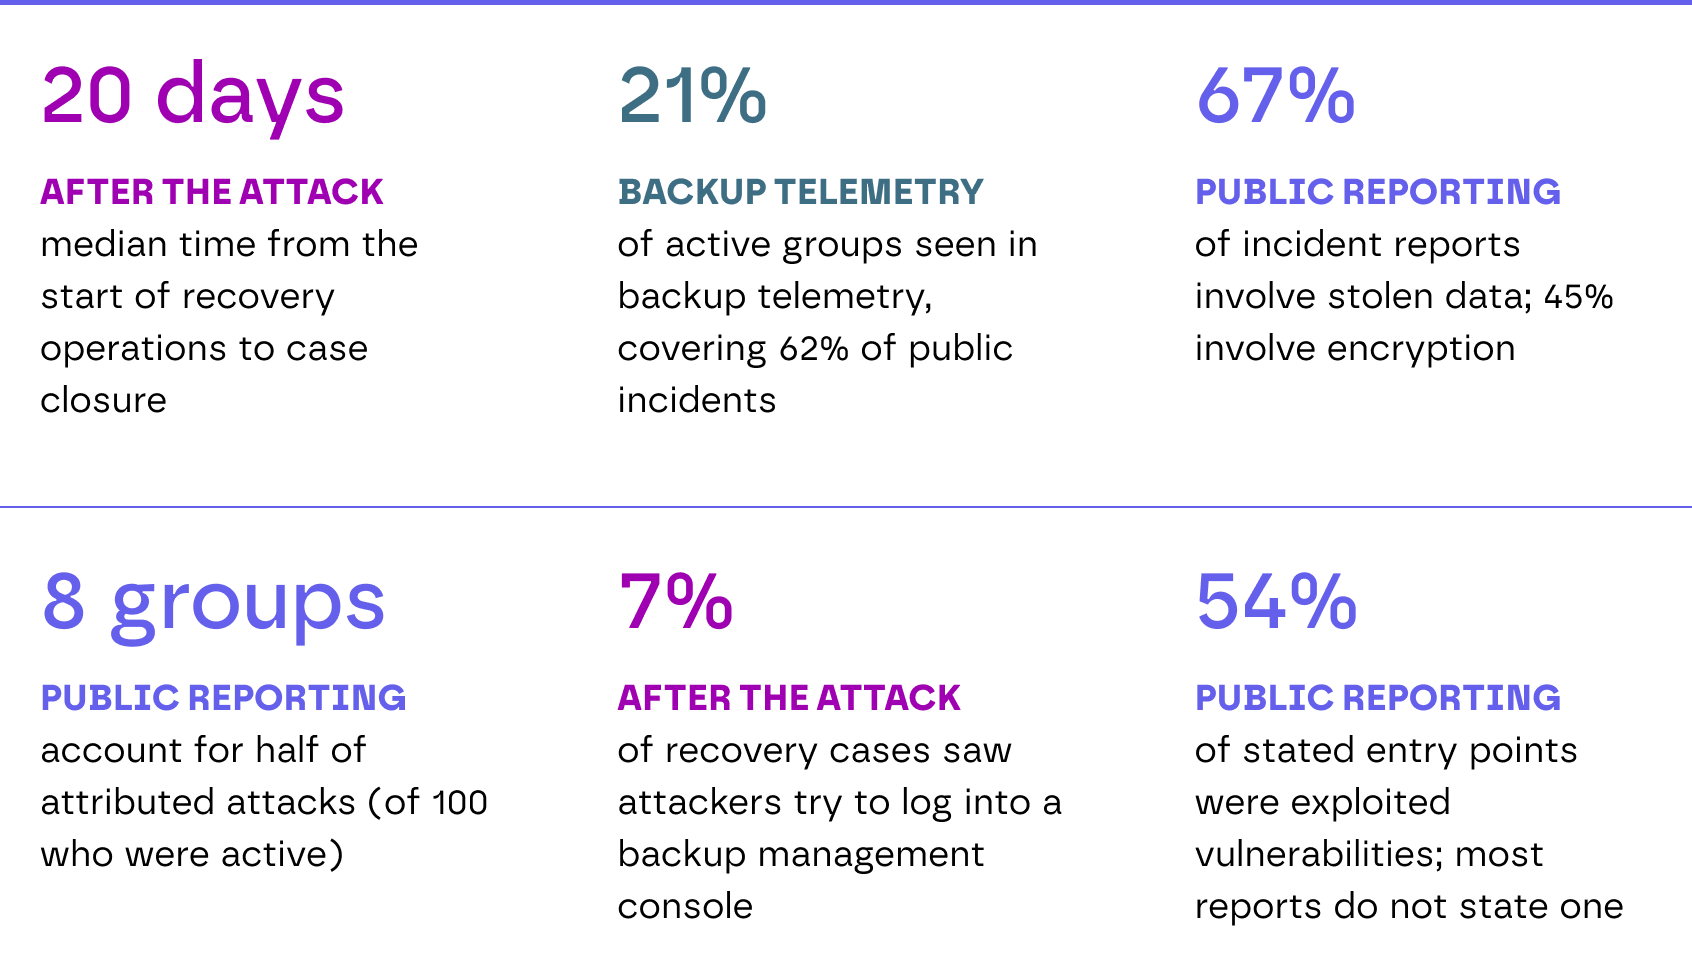
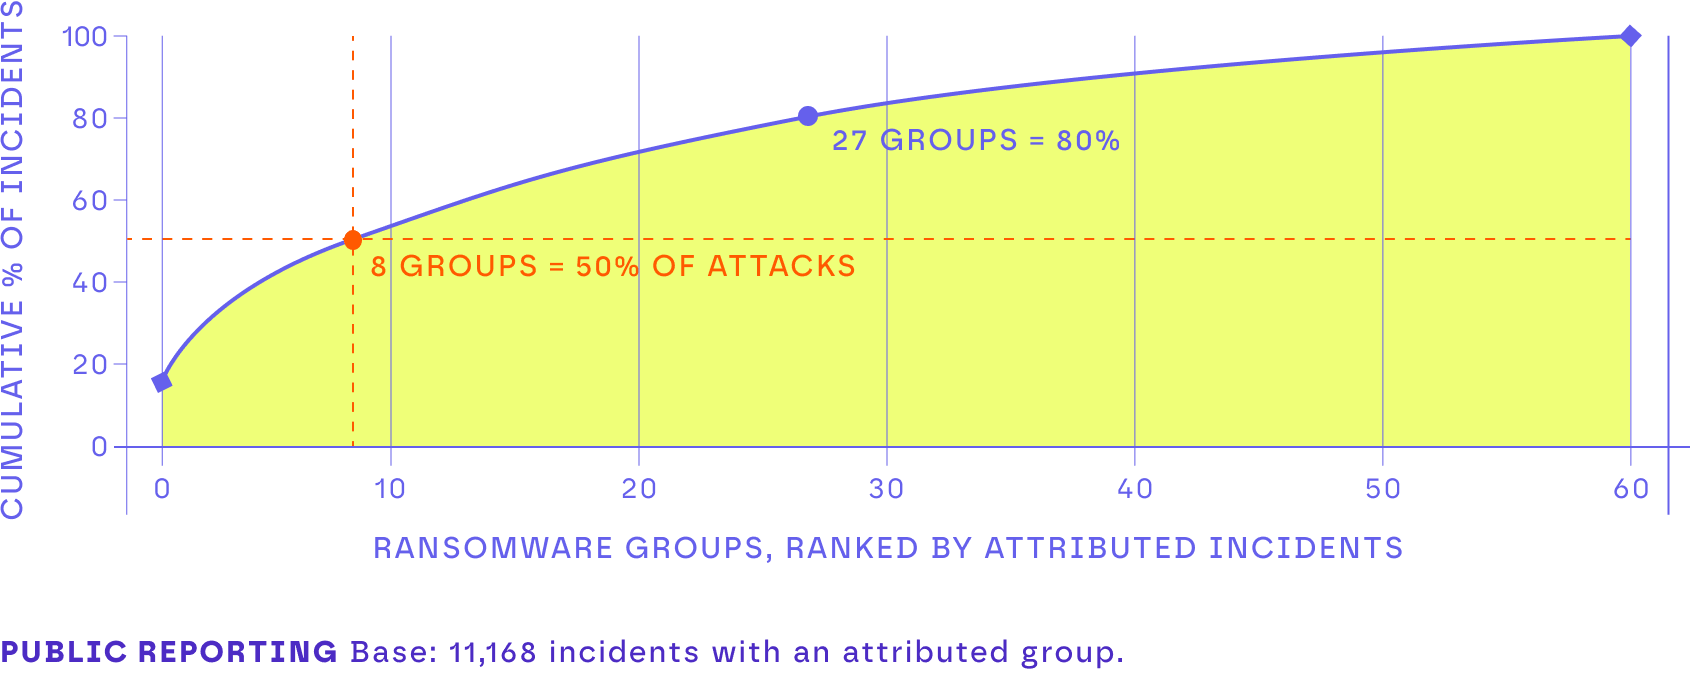
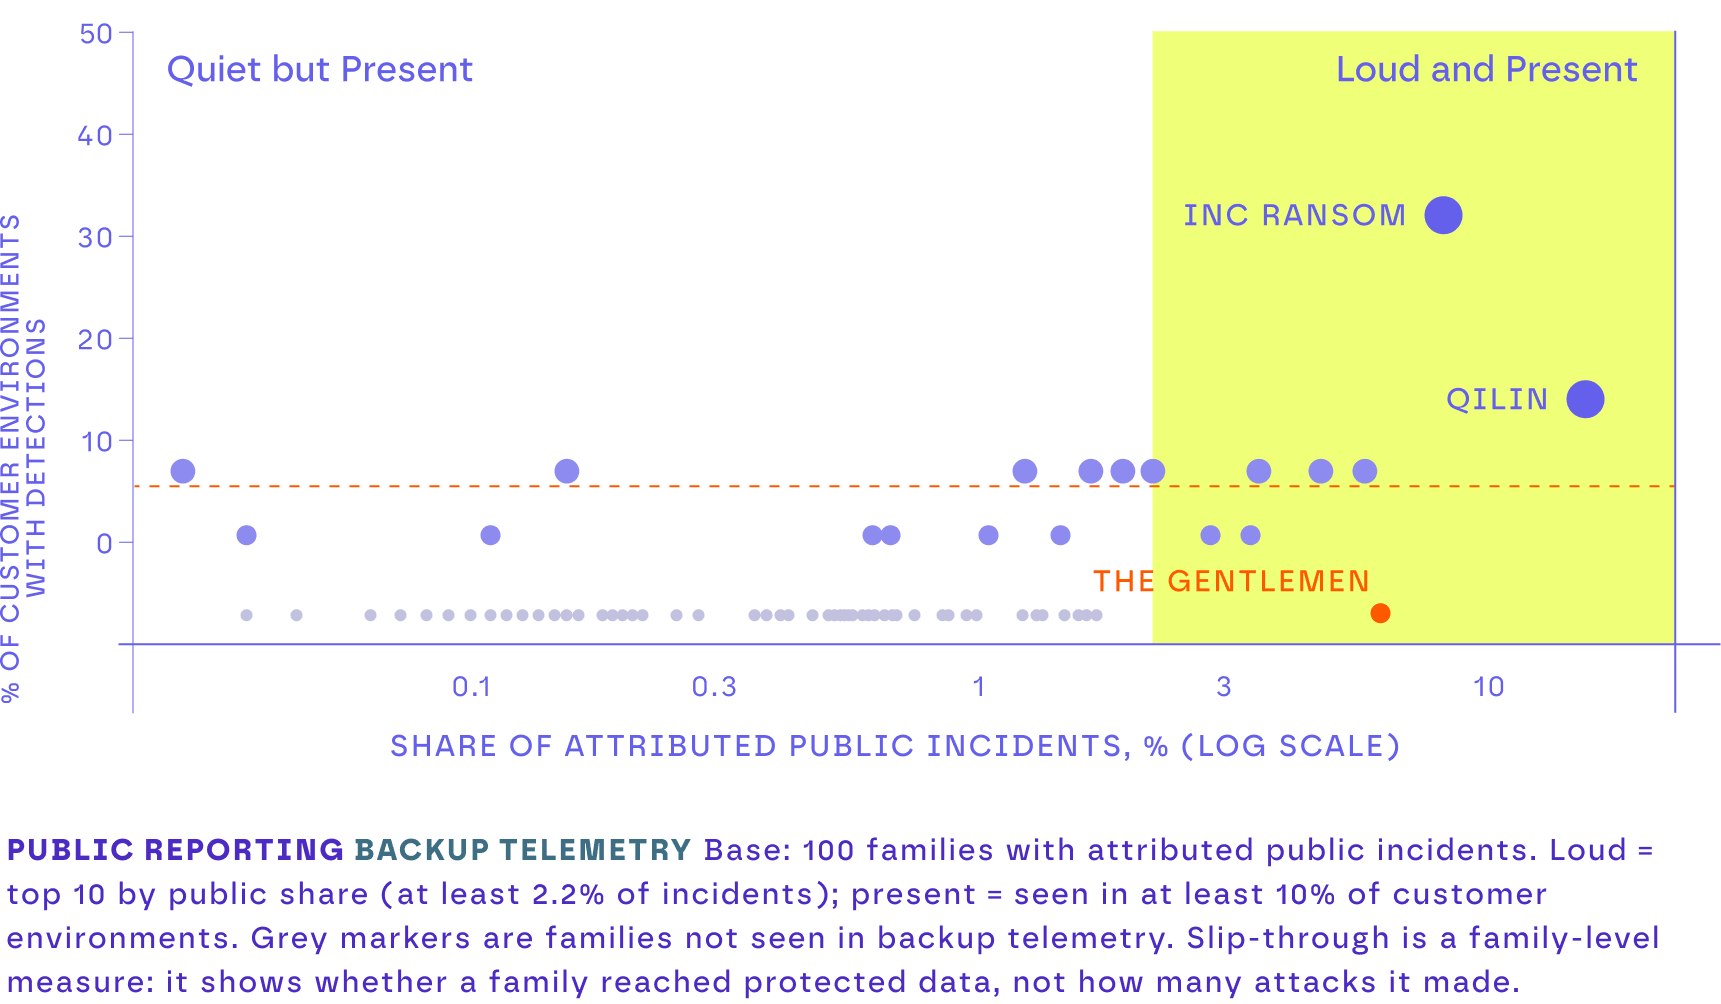
100 groups published victims in 2026, but activity is highly concentrated: Qilin, INC Ransom and The Gentlemen alone account for 30% of attributed incidents. The other two lenses show how much of that reaches customers. Nine of the ten most active groups were seen in backup telemetry, five were named in recovery cases, and seven groups appear in all three.
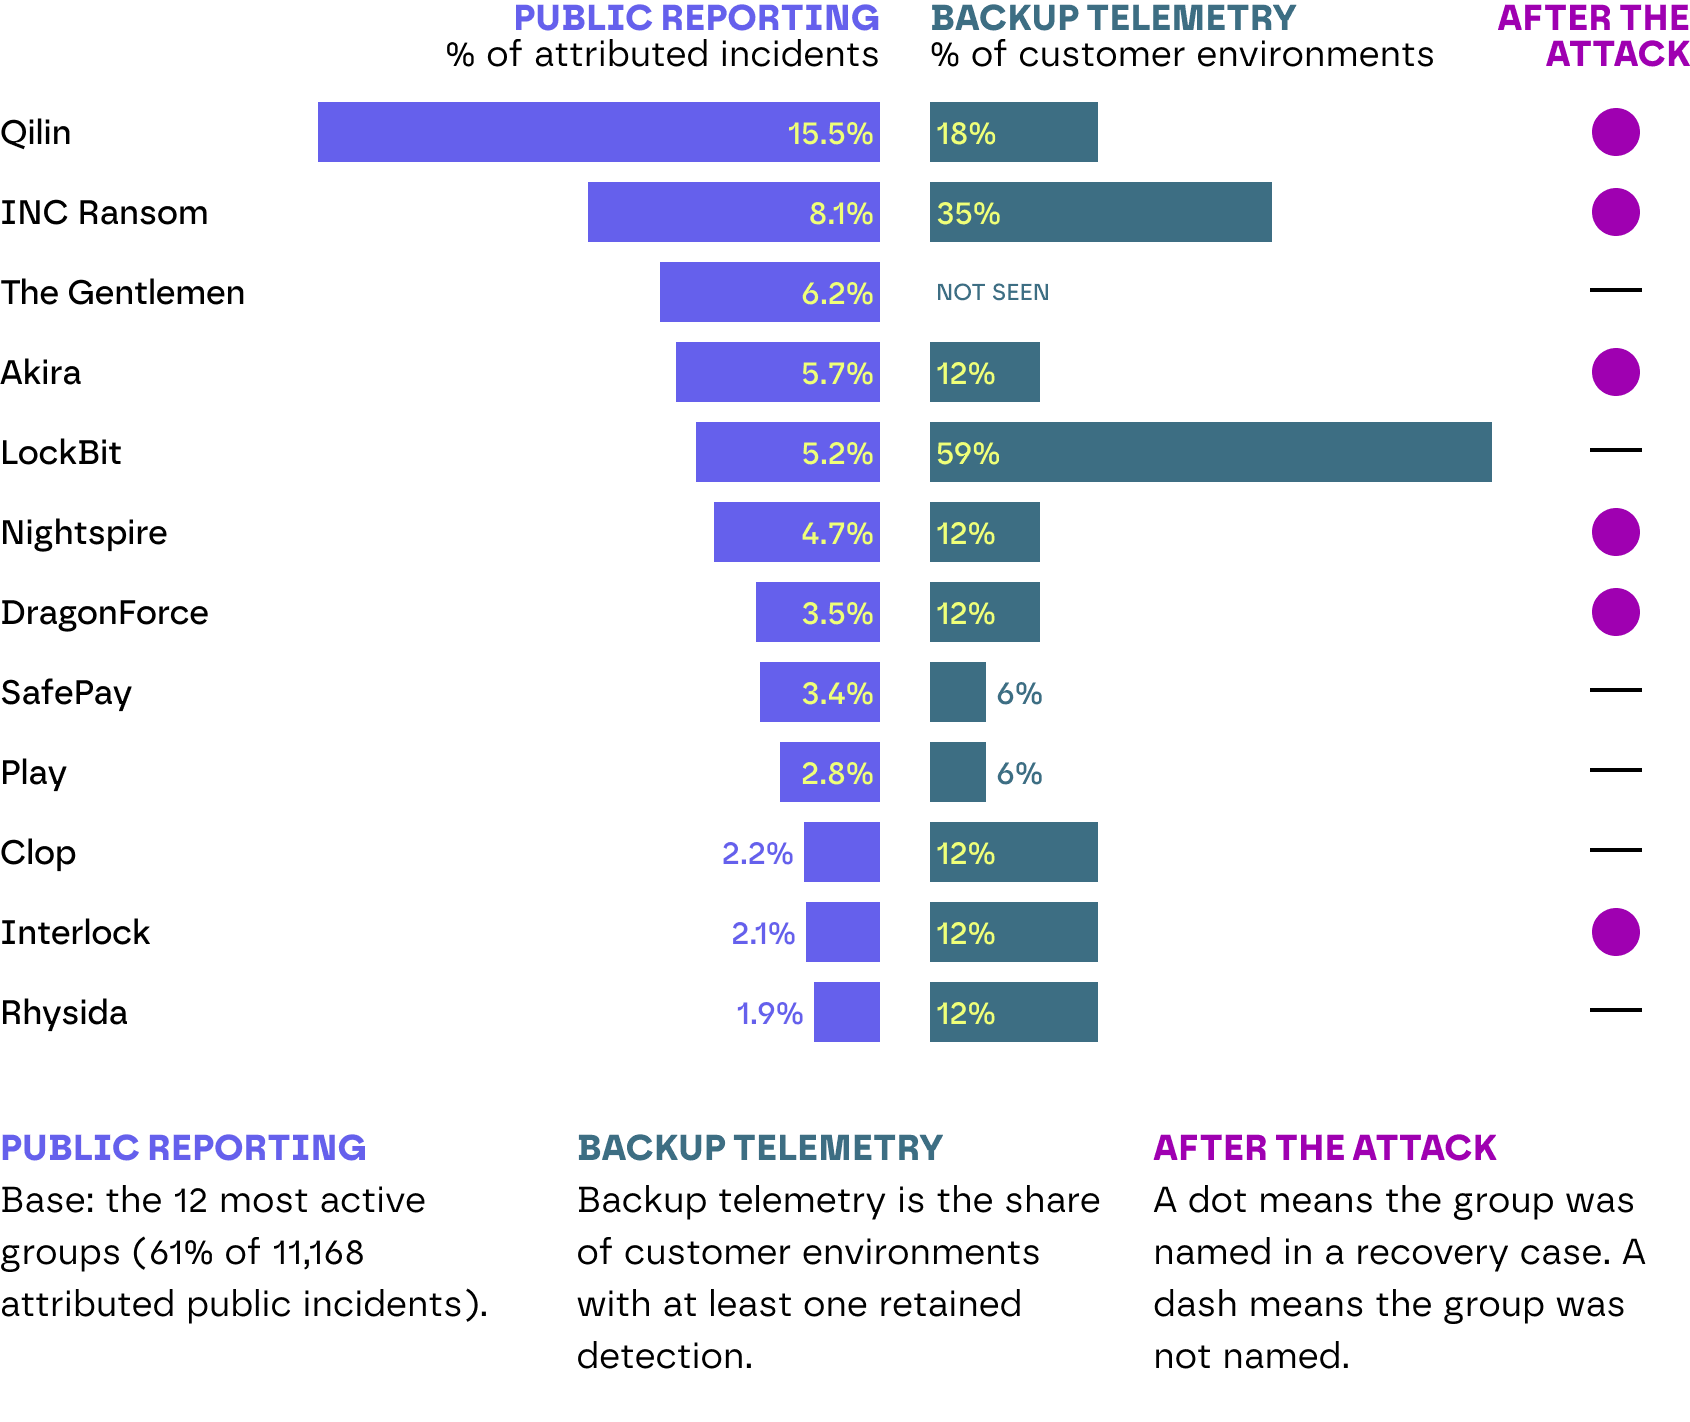
Qilin, INC Ransom, Akira, LockBit, Nightspire, DragonForce and Clop are loud in public reporting and present in customer environments, making them confirmed threats to prioritise. The Gentlemen ranks among the most active in public reporting, yet was not seen in telemetry or recovery cases.
So what?
Resilience should not hinge on knowing who the attacker is. Groups seen across public reporting, backup telemetry and recovery cases are the clearest evidence of what organisations face, so plan and rehearse recovery against their methods first. The long tail matters too: only about a third of identified recovery cases involved a top-ten group, so recovery readiness has to hold up against any group, including ones that are loud in public reporting but not yet seen in customer environments.

Public reporting | Concentration and Churn
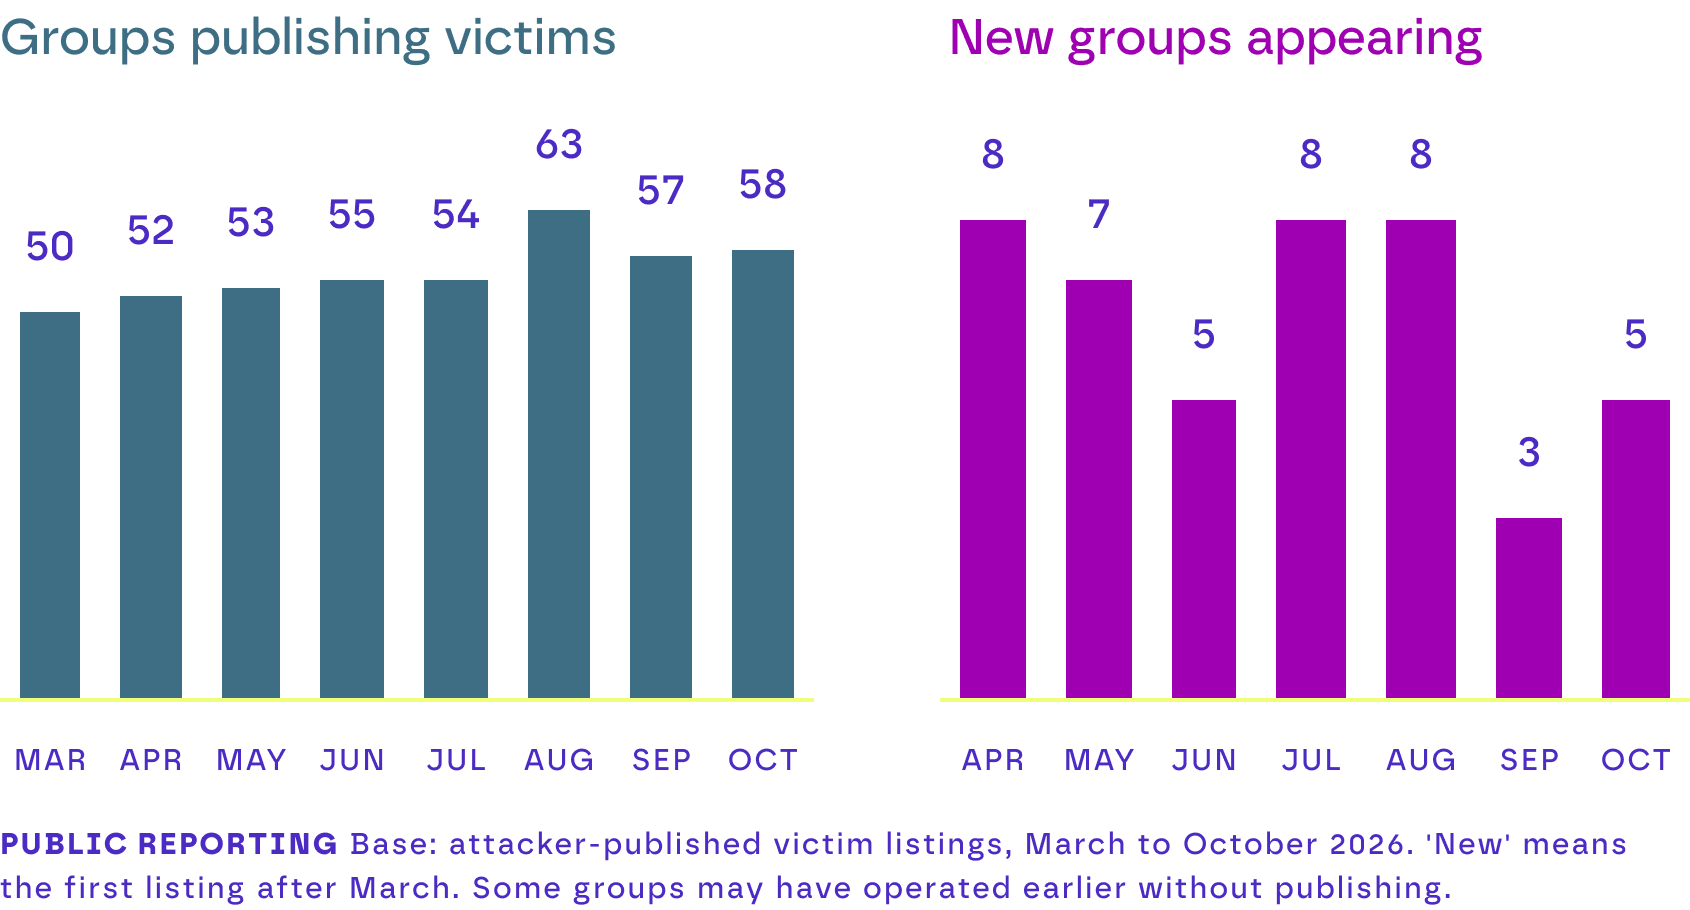
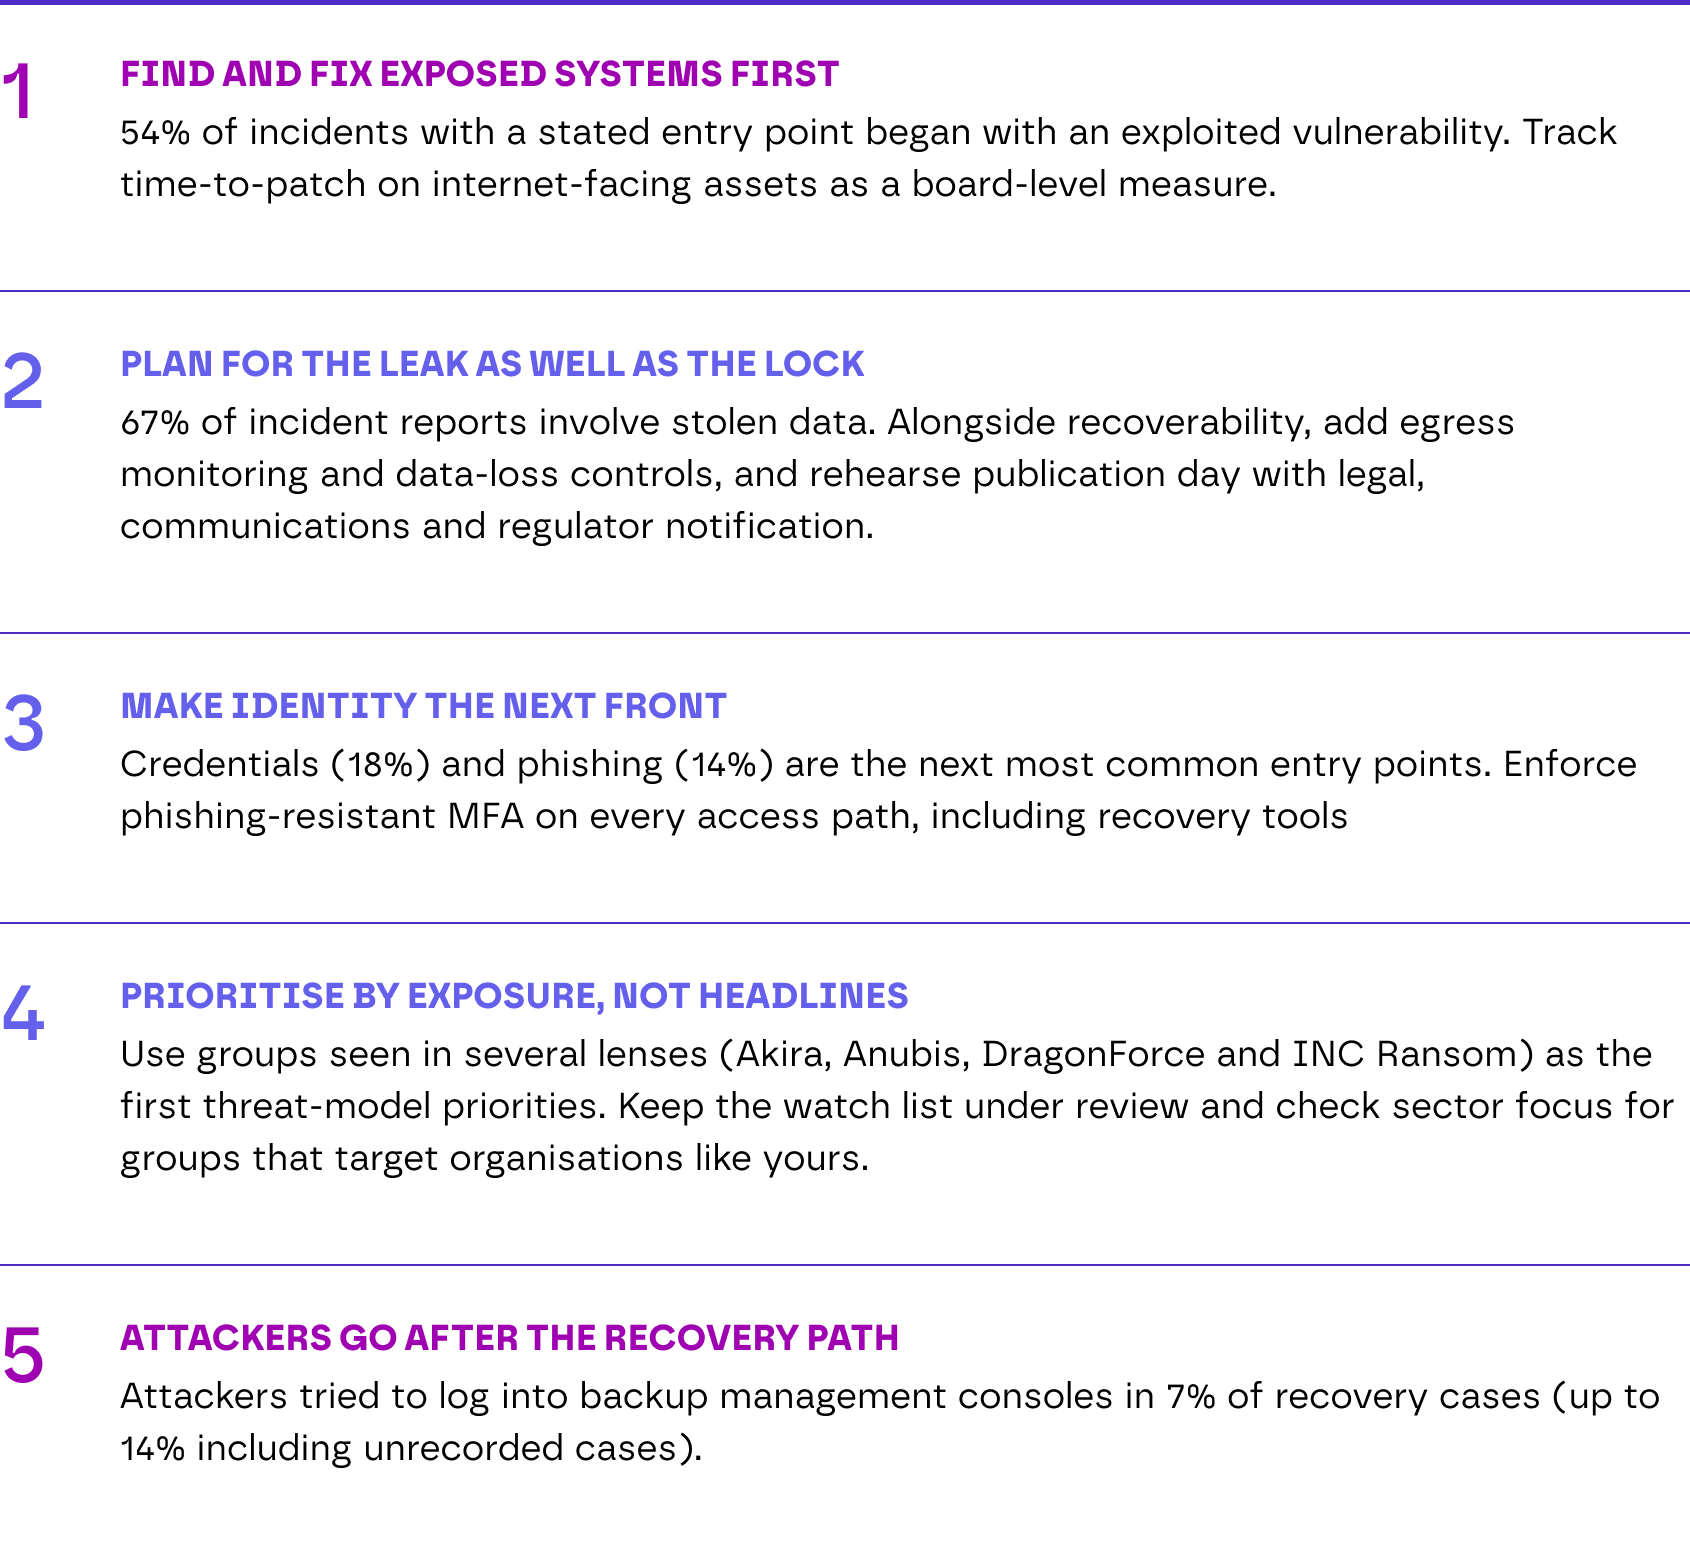
The threat keeps changing,with 44 of the 100 active groups only appearing after March and 50 to 63 groups posting new victims every month. Behind the eight biggest groups, 92 others are also active. Recovery plans should therefore be built to handle common attack methods, not just specific named groups.
Chapter 02 | The playbook: Stolen data is standard and recovery is a target
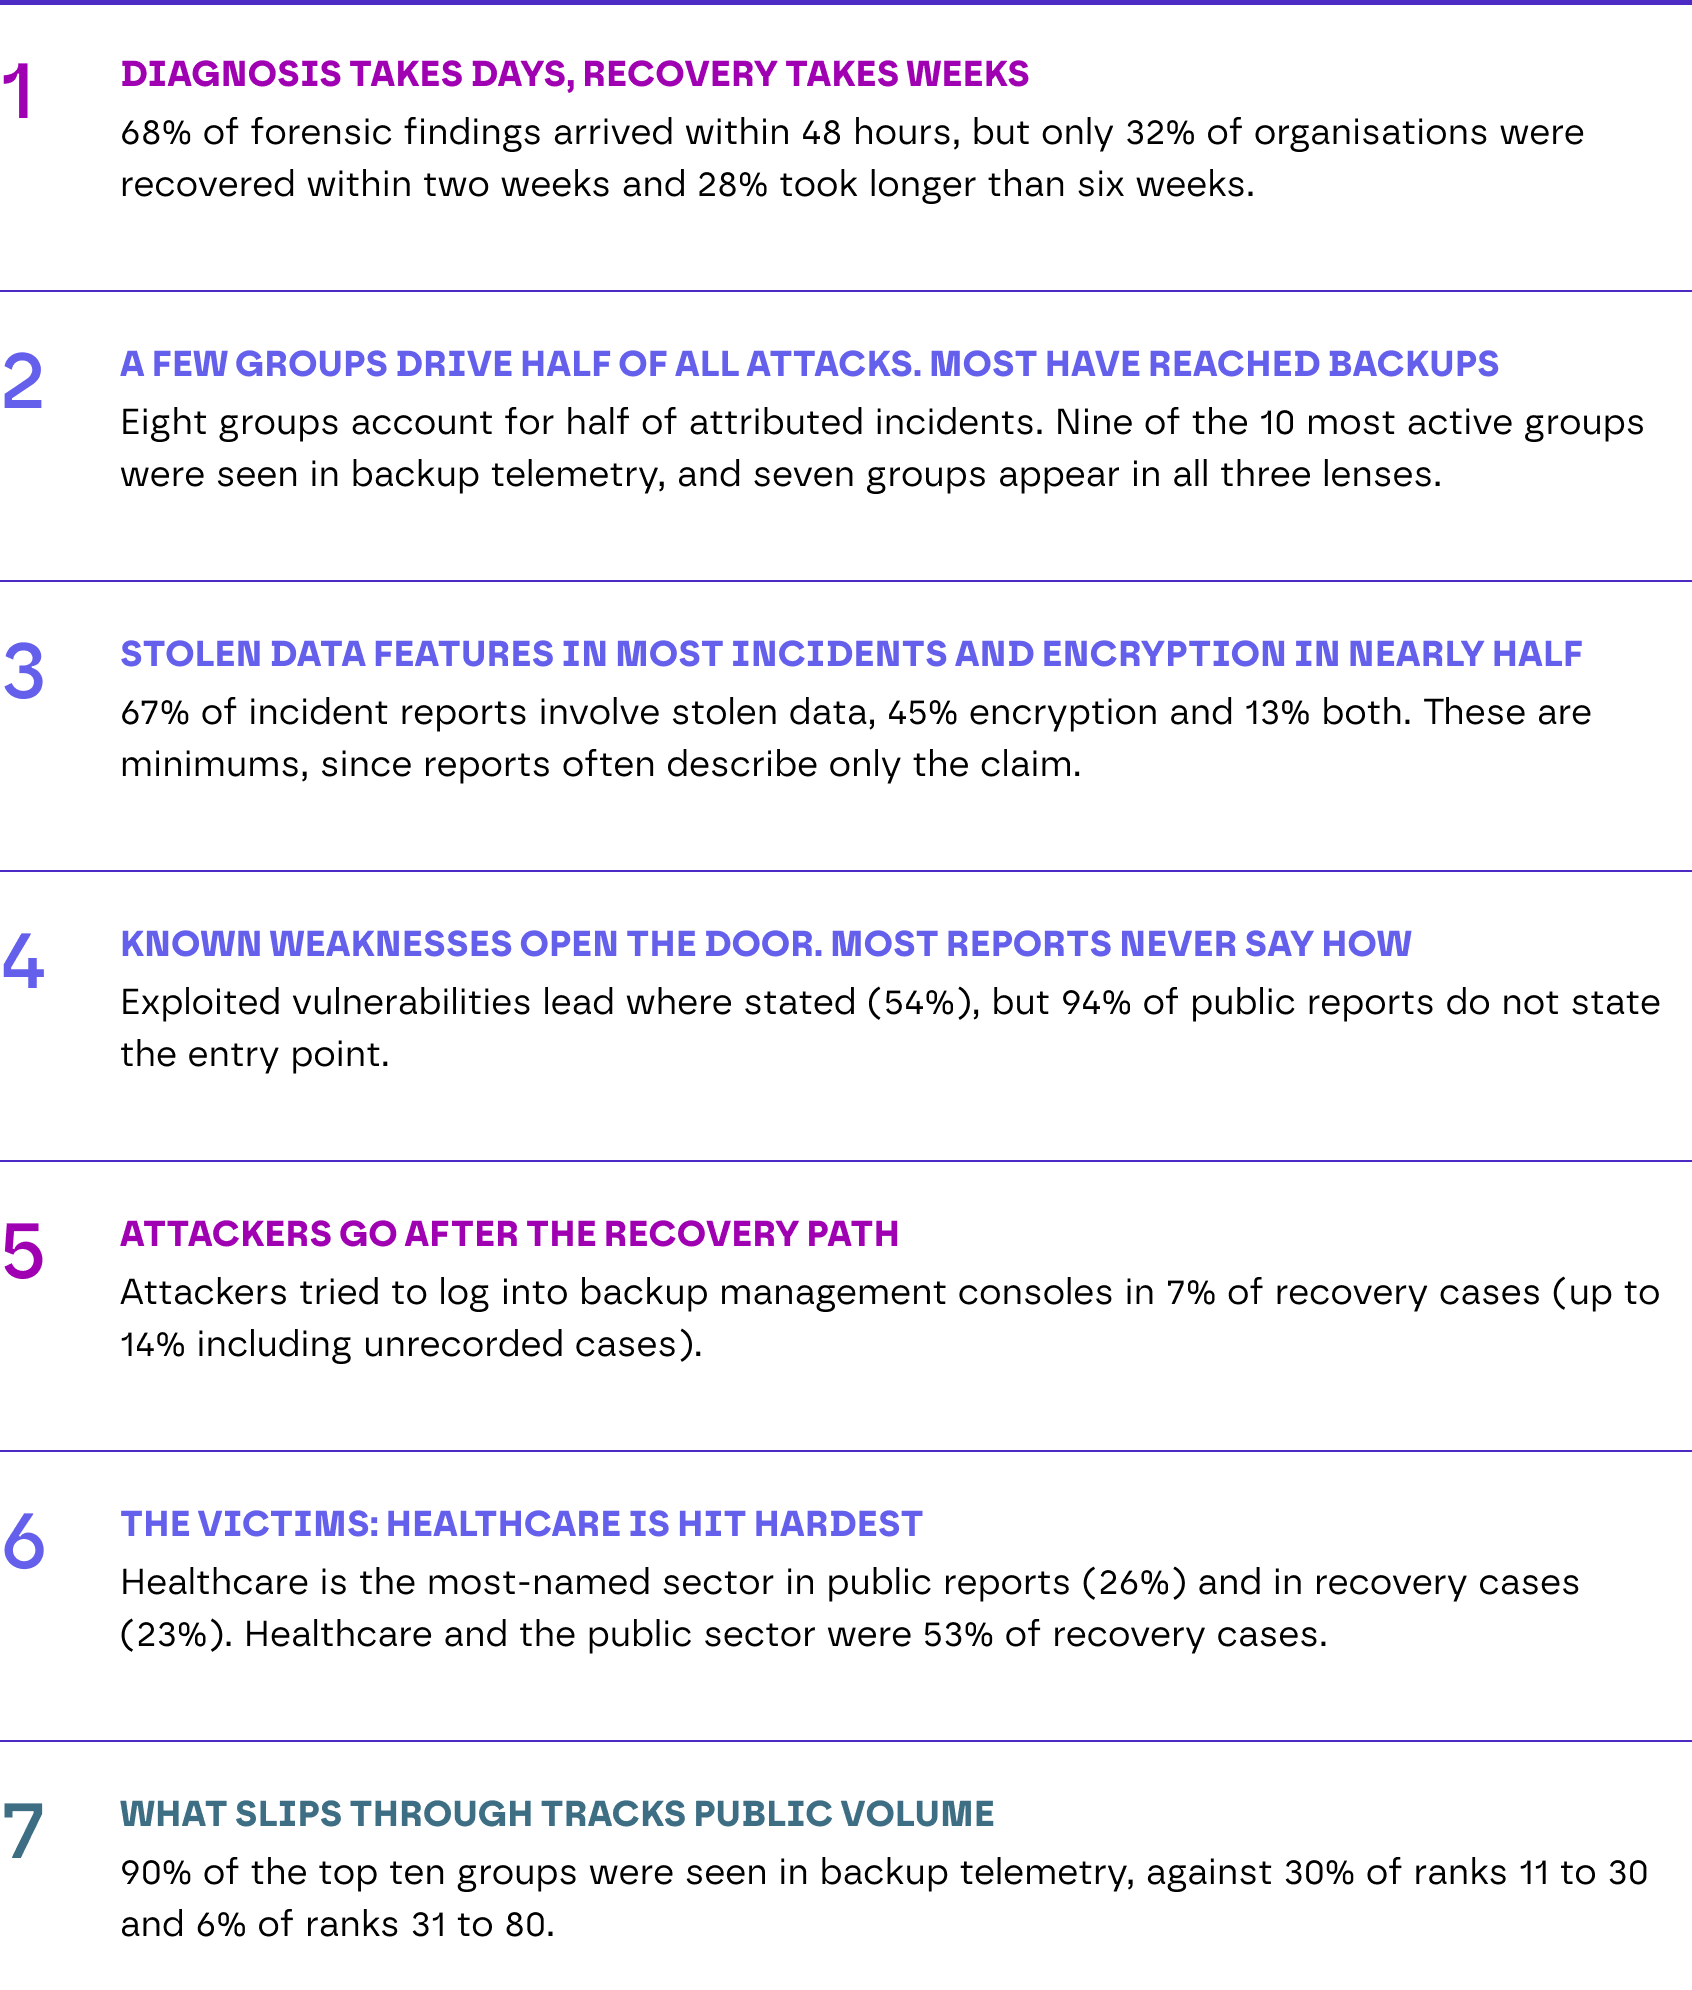
Of 2,931 incident reports that describe how the victim was extorted, 67% involve stolen data and 45% explicitly involve encryption; 13% report both. Both figures should be treated as minimums since a report only records what its author chose to describe.
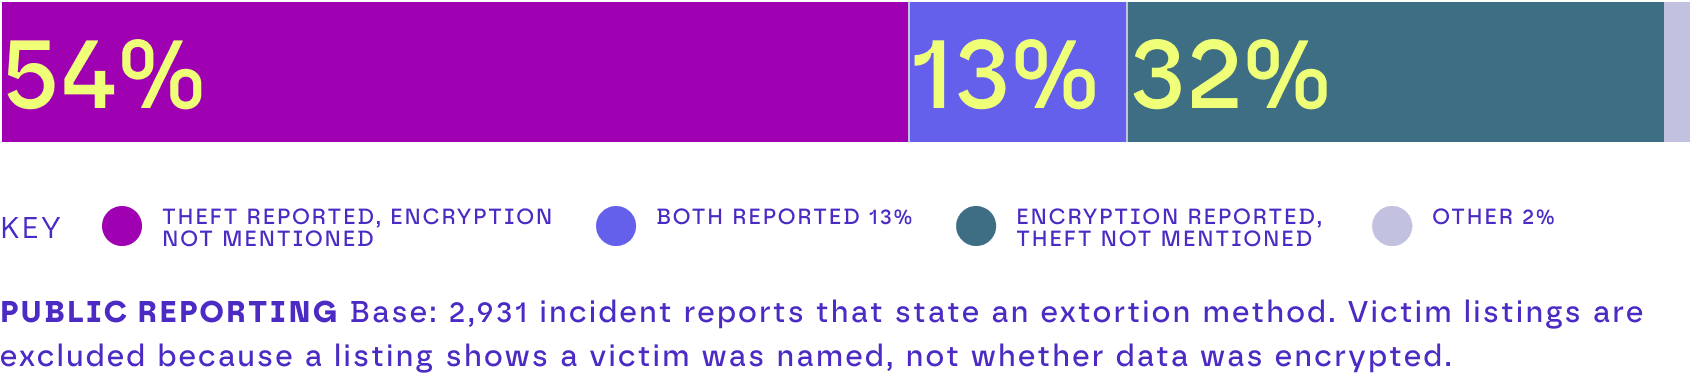
The 54% segment should not be read as theft-only attacks. Most of these are claim-style reports, such as a group announcing it holds a victim's data, which rarely states whether systems were also locked. A text check found explicit statements that no encryption took place in fewer than 2% of reports. Some groups do extort without encrypting, but this data cannot gauge the size of that share reliably.
How they get in
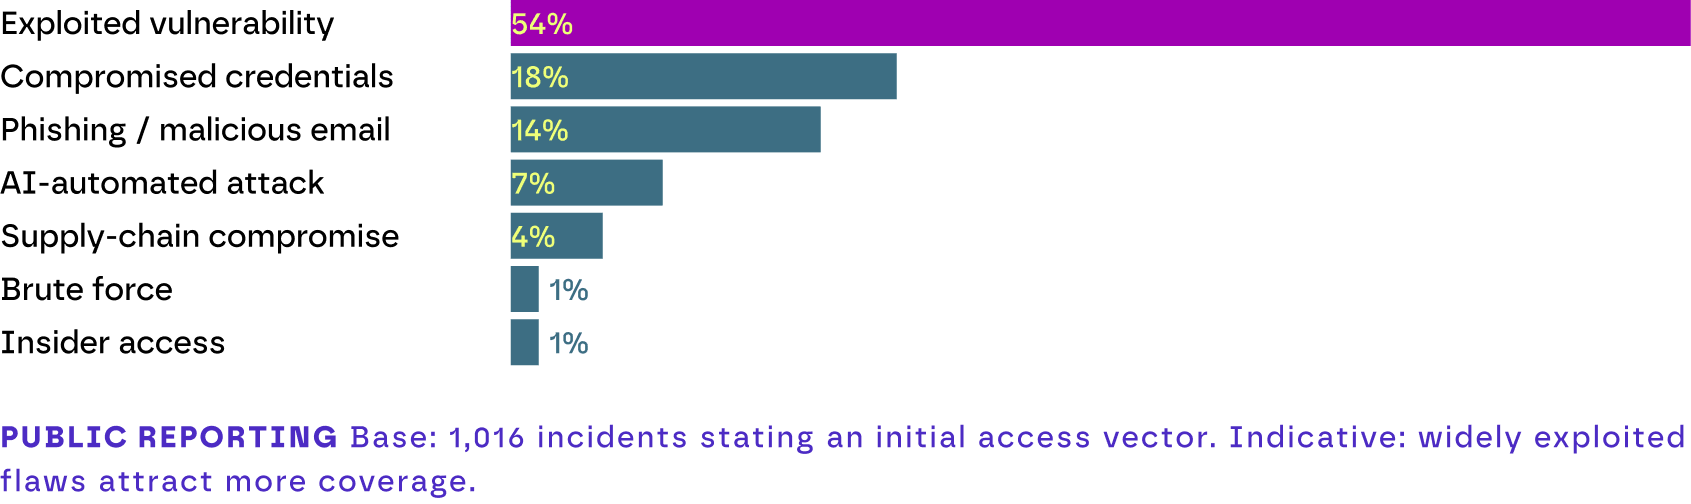
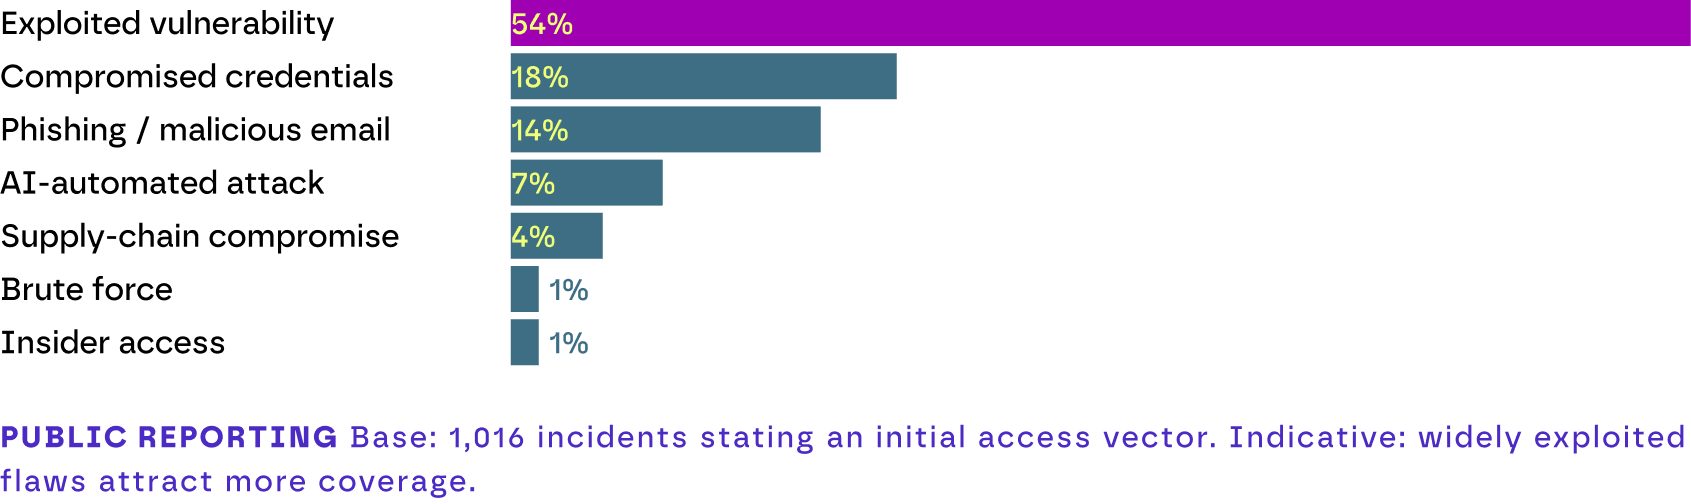
Where the entry point is stated, 54% began with an exploited vulnerability, followed by compromised credentials (18%) and phishing (14%). In 94% of public incident reports, no entry point was stated at all.
Attackers go after the recovery path
In at least 7% of recovery cases, the attacker attempted to log into the organisation's backup management console. The true share may be as high as 14% because the field was not recorded in some cases. Attackers who reach recovery tools can undermine recovery itself, so access to such tools deserves the same protection as any other privileged system.
So what?
Cyber resilience must cover two outcomes: restoring operations and limiting what attackers can do with stolen data. Plan for both by protecting recovery tools like any privileged system and assuming the entry point may never be known. Controls that do not need attribution like tested recovery, least privilege and monitored recovery infrastructure matter most.
CHAPTER 3 | The victims: Healthcare hit hardest first in both views
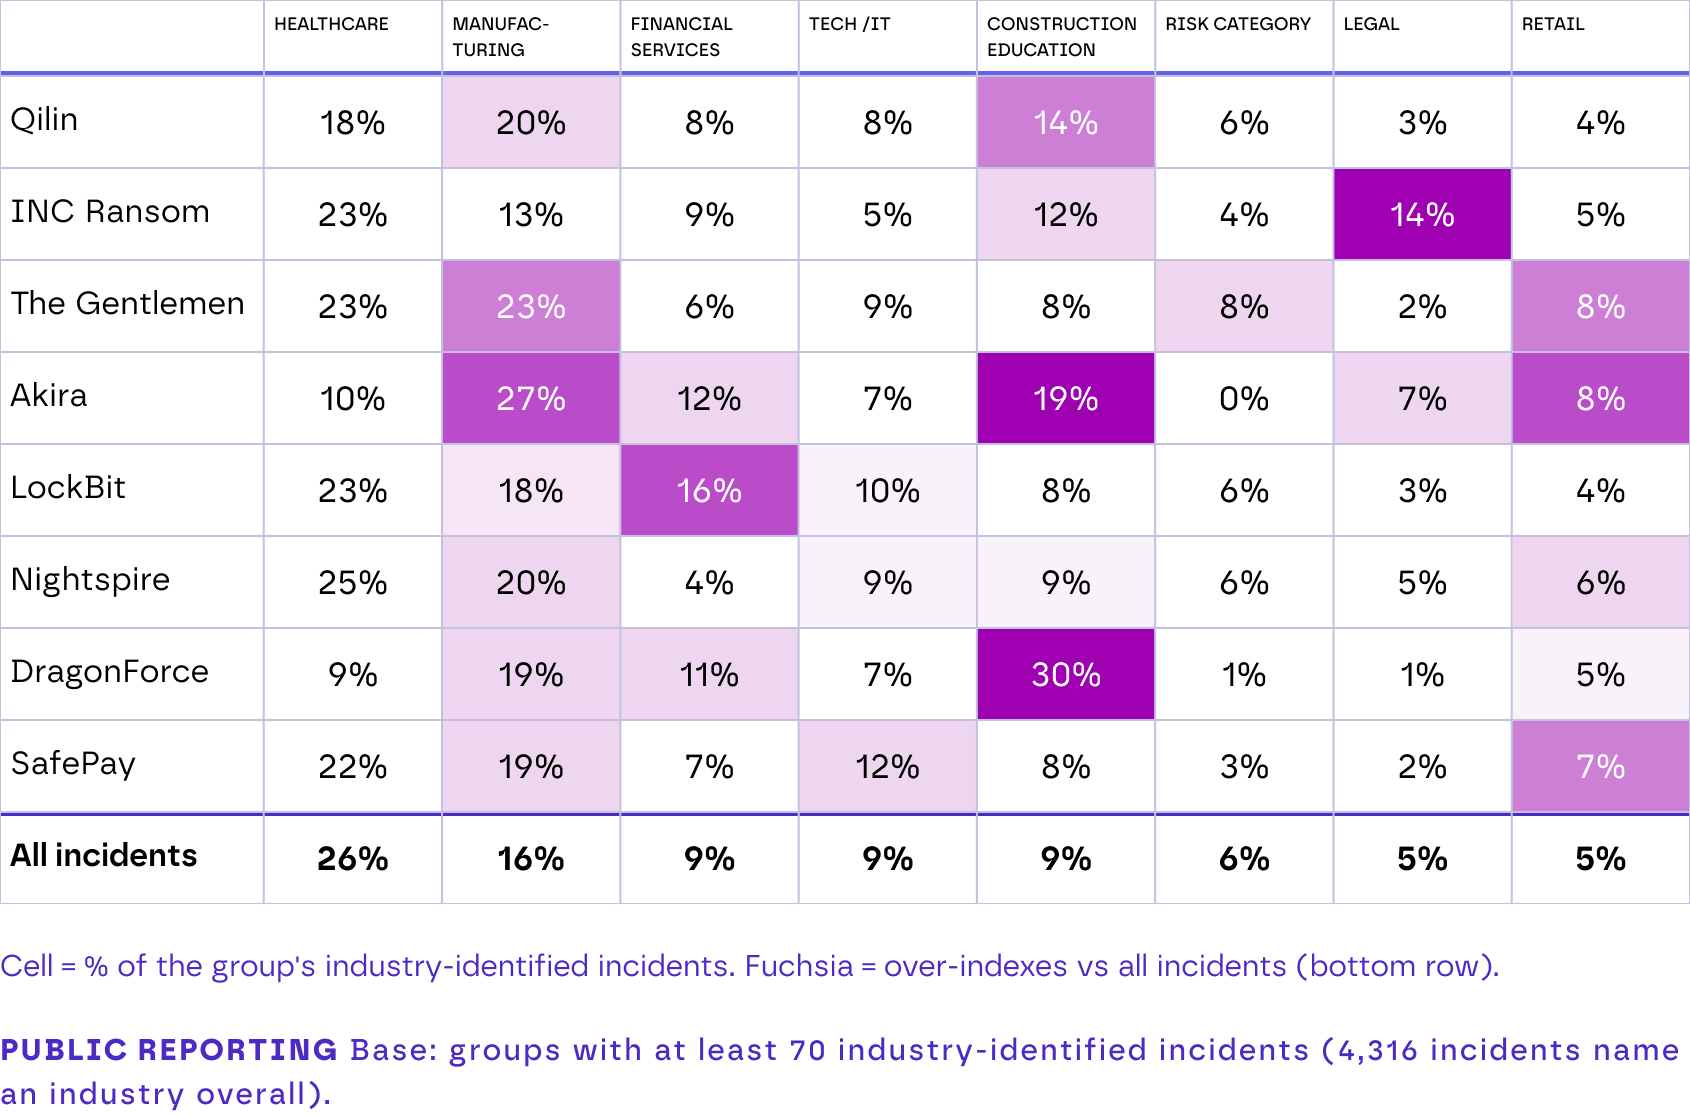
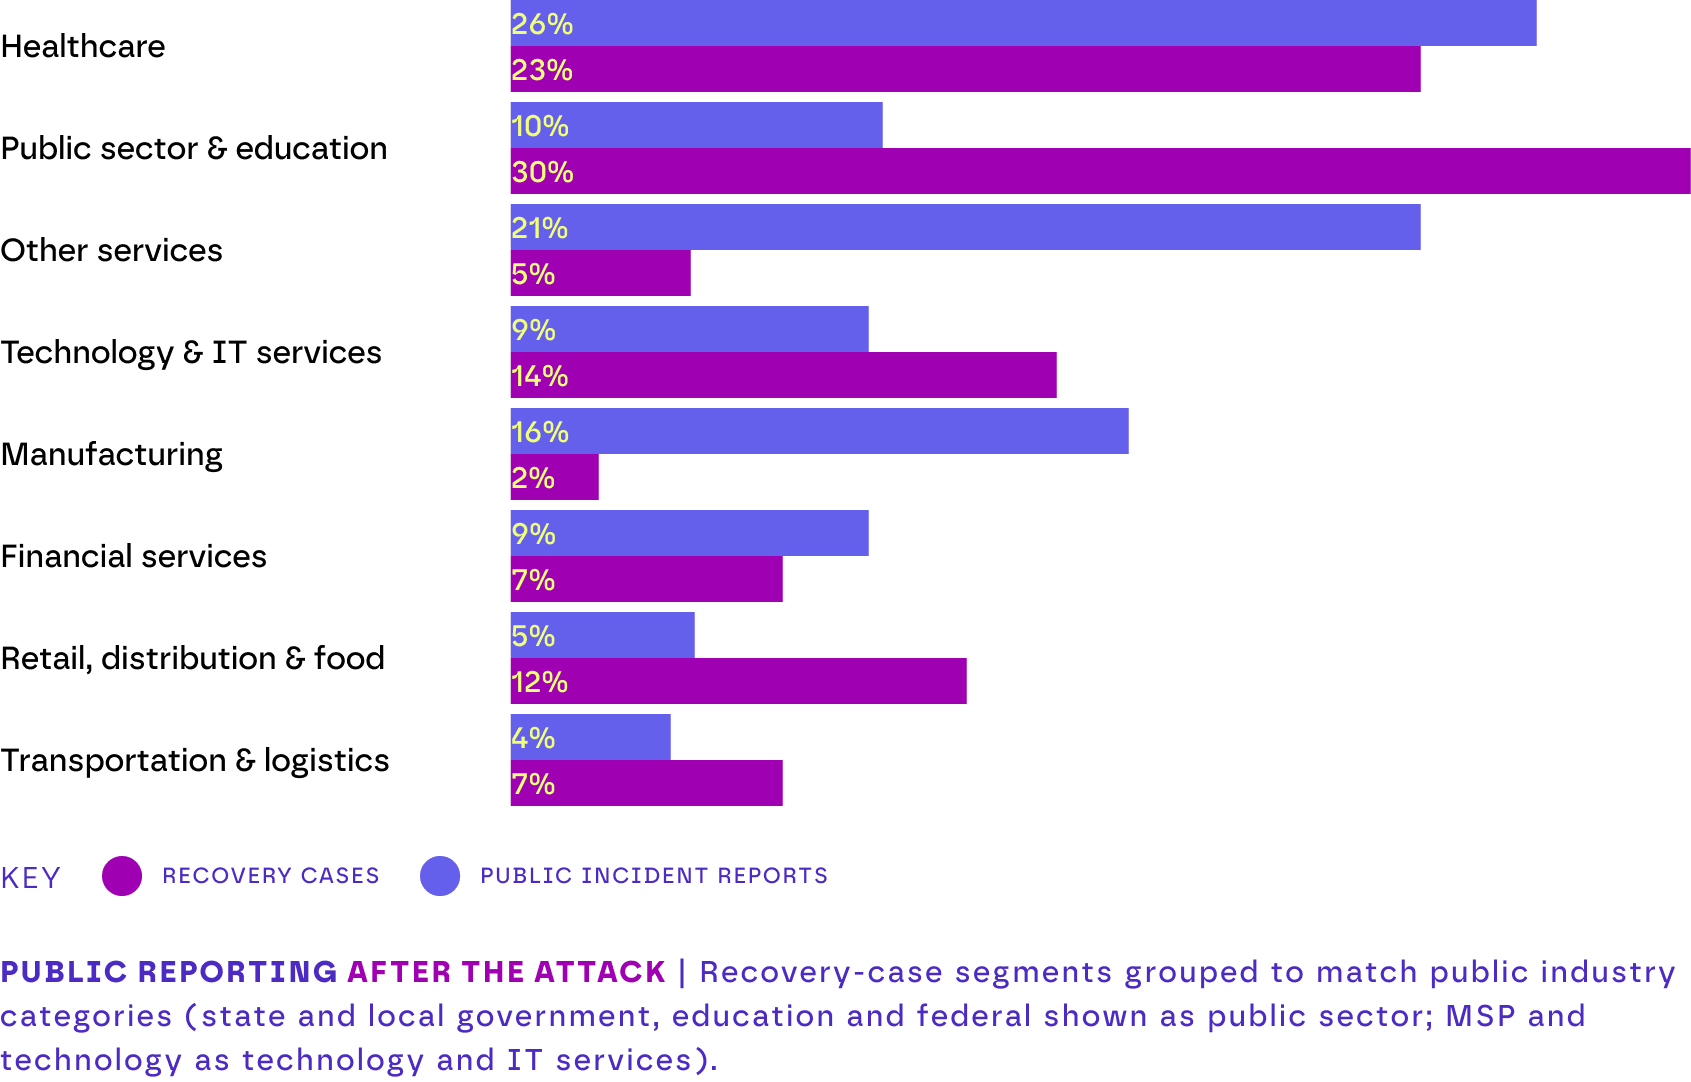
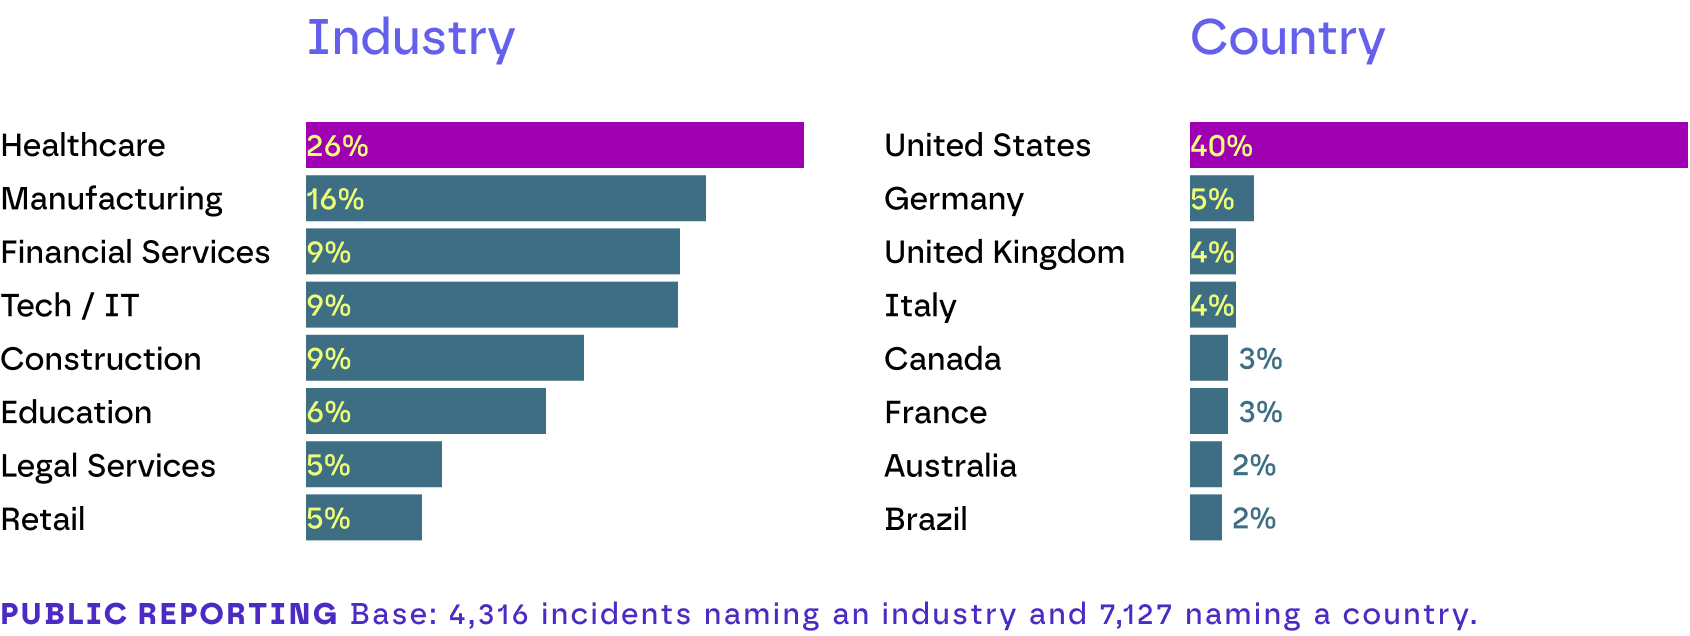
Healthcare is the sector hit most often both in public reports (26% of incidents where the victim’s industry is known) and in recovery cases (23%). Some groups focus on specific sectors. DragonForce, for instance, aims 30% of its known victims at construction and real estate, compared with 9% across all groups.
Public reporting | Geography
The United States is the most-named country (40% of incidents naming a country), followed by Germany (5%) and the United Kingdom (4%). The share varies sharply by group, from 16% to 76% of a group's victims, so exposure depends on who targets your region.
So what?
Resilience planning works best when it is specific. Which groups matter depends on your sector and country, and the leaders for one sector are not the leaders for another. Use this to choose which scenarios to rehearse.
CHAPTER 4 | What gets through and what it costs
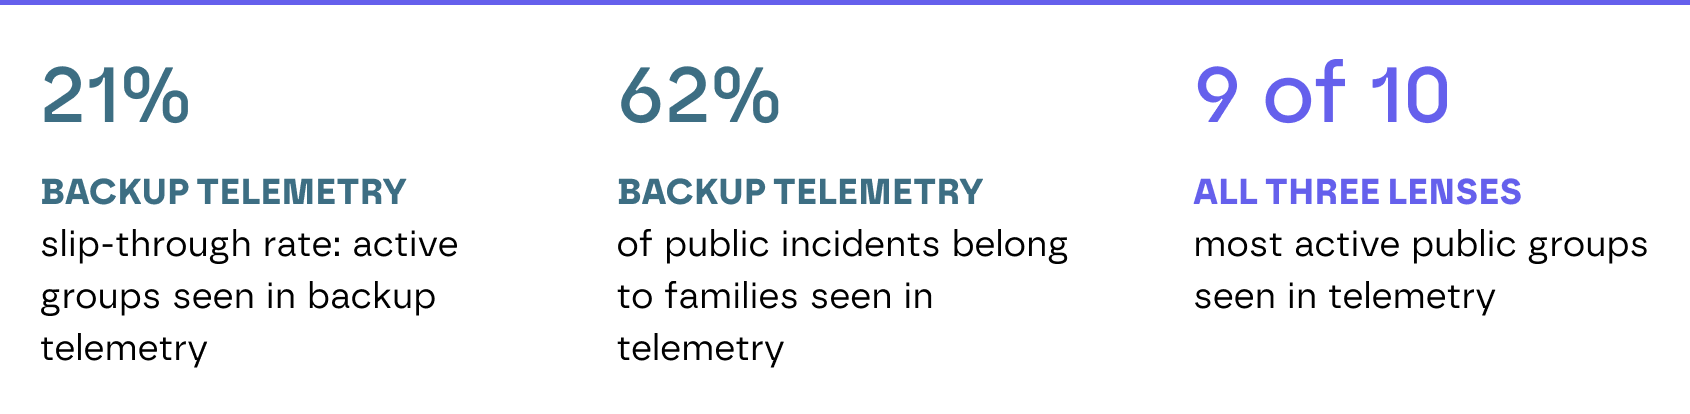
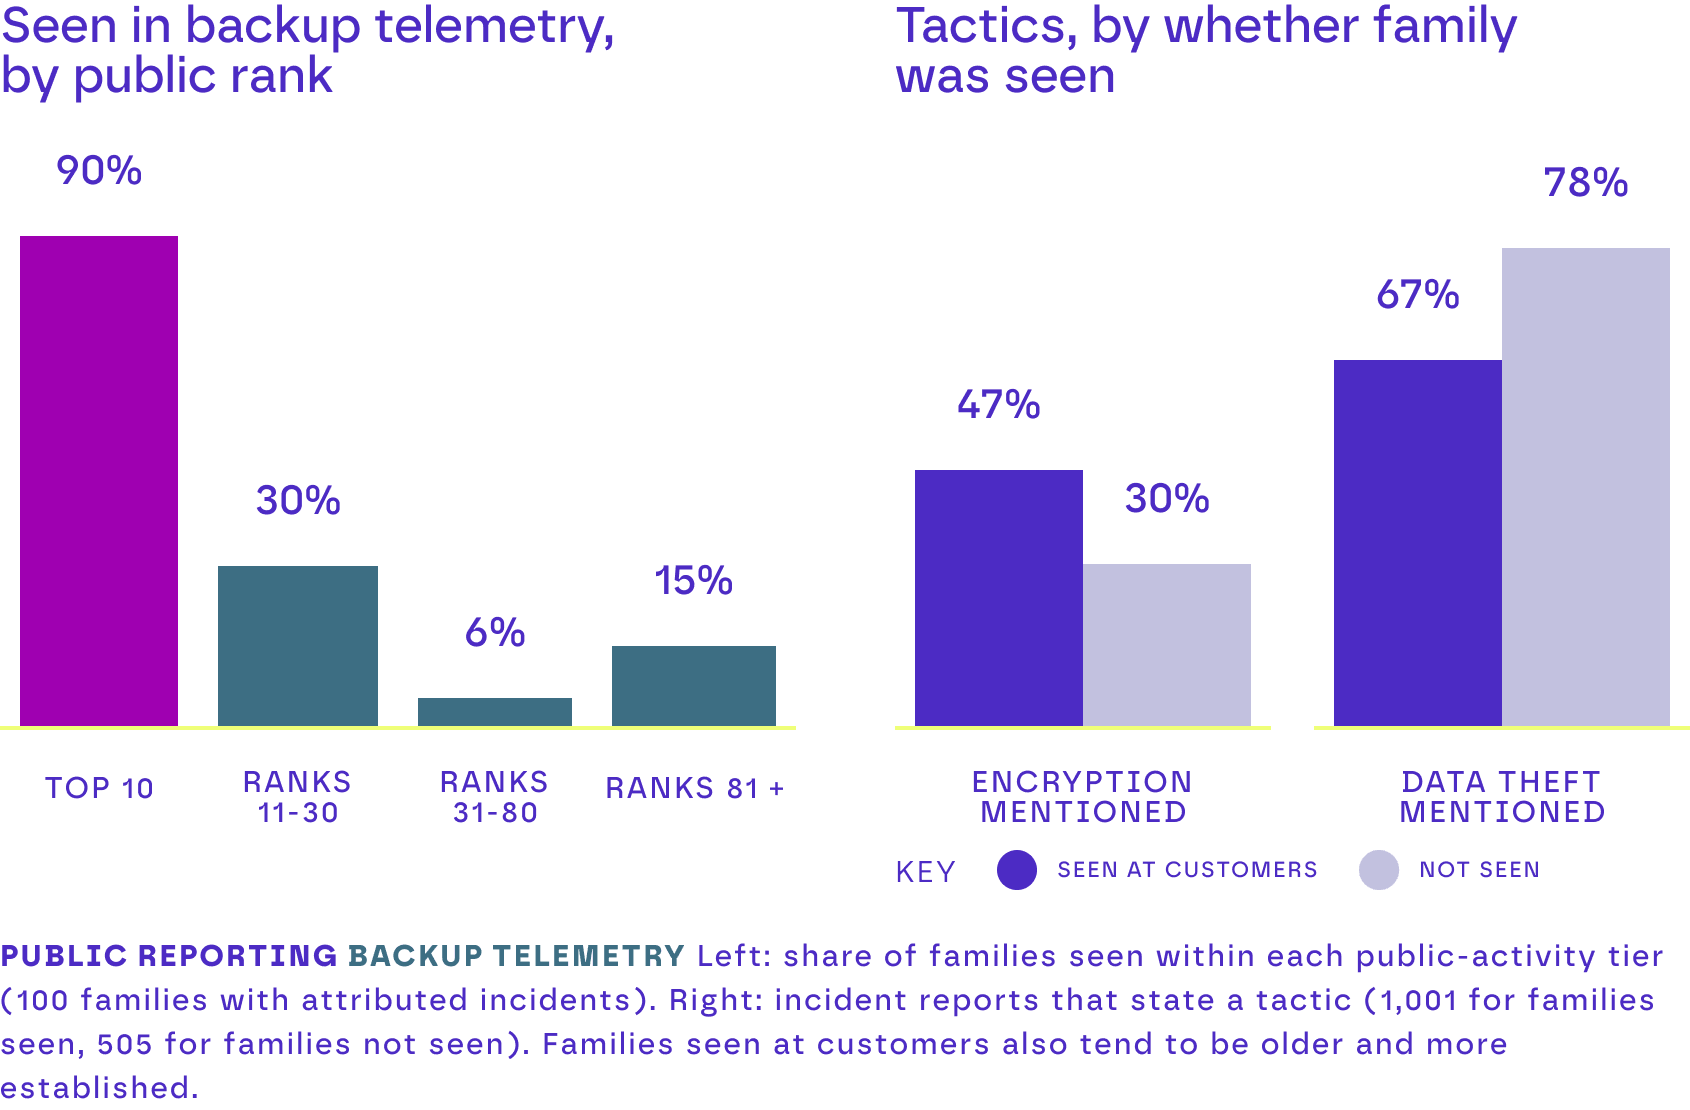
Backup scanning only picks up threats that have already evaded an organisation’s outer defences. Of the 100 groups active in public reporting, 21 were also detected in customer backups, and those 21 groups are behind 62% of publicly reported attacks. The more active a group is publicly, the more likely it is to show up in backups. Nine of the 10 most active groups were detected, compared with 30% of groups ranked 11 to 30 and 6% of those ranked 31 to 80. Even so, smaller groups still reach protected data.
Backup Telemetry: Where lenses meet on tactics
Families seen in backup telemetry mention encryption in 47% of their incident reports, against 30% for families not seen. Families that deploy encryptors leave artifacts in protected data, which fits the pattern, though part of the gap may reflect reporting style. Backup scanning is a useful independent signal and helps confirm a clean recovery point, but the absence of a detection is not proof that no data was stolen.
What it costs: recovery time
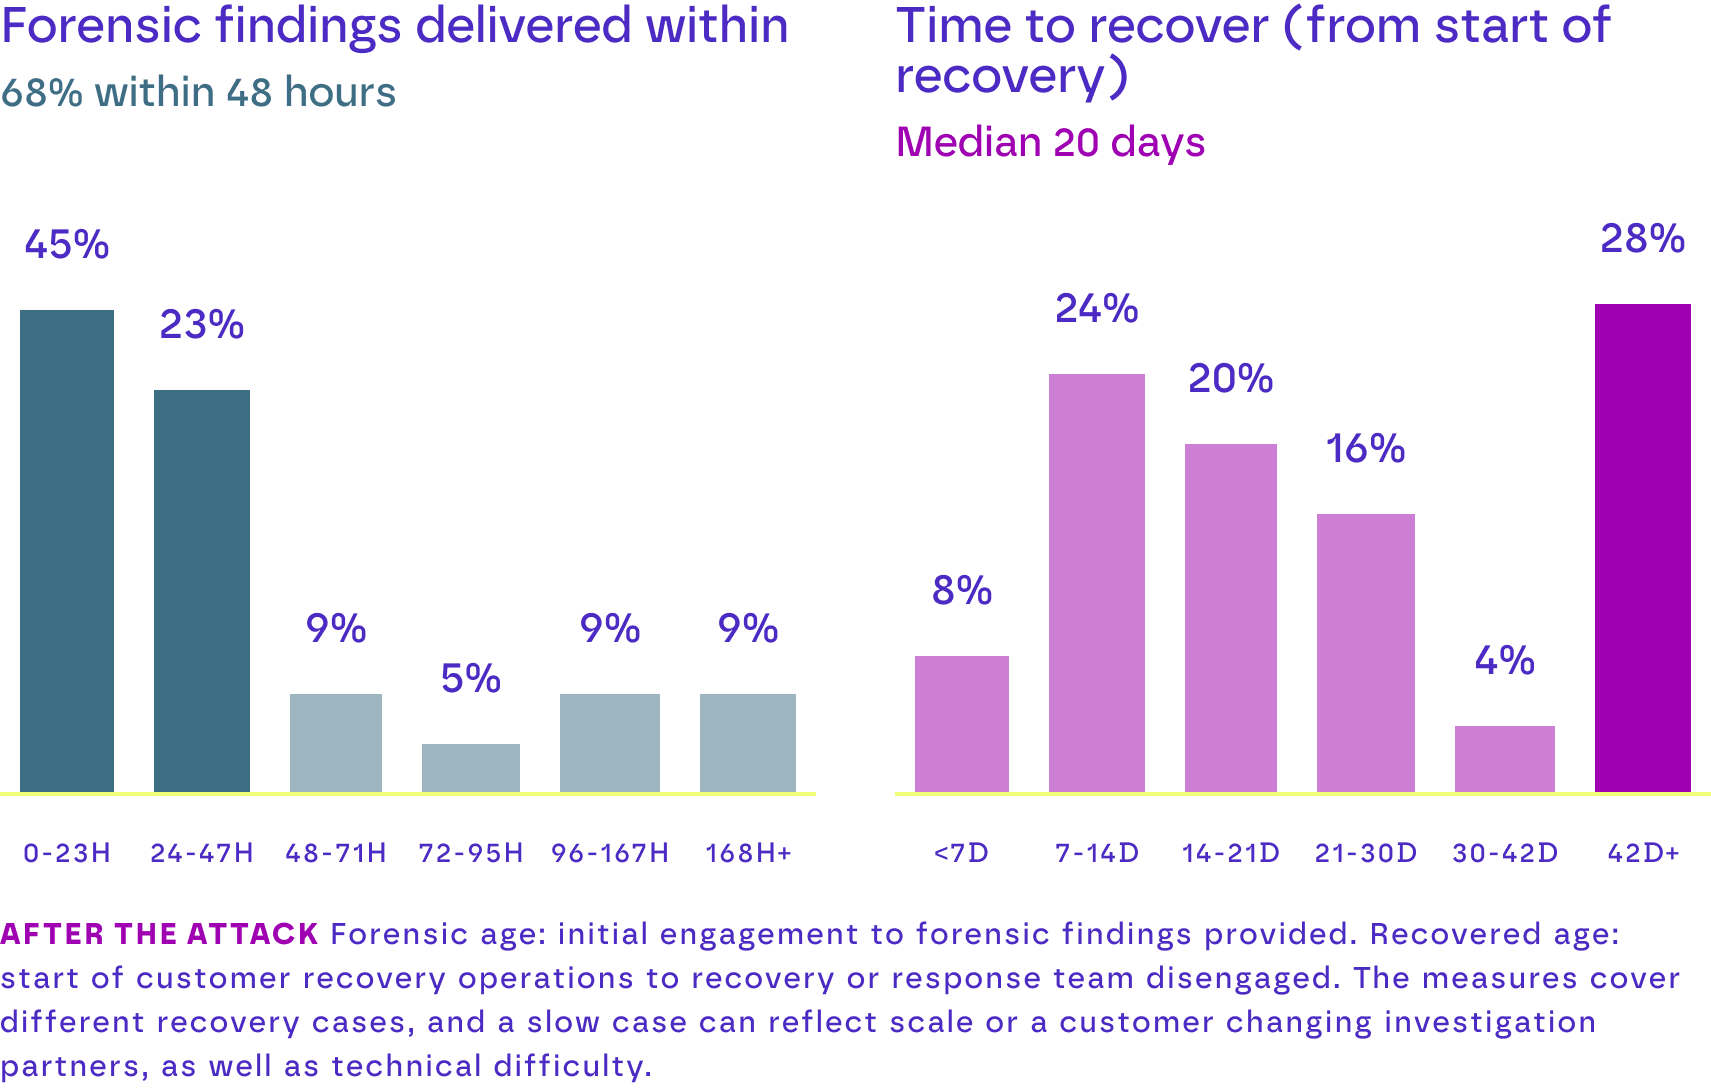
AFTER THE ATTACK Forensic findings arrive quickly: 45% within 24 hours and 68% within 48 hours. Recovery is far slower. The median organisation needed 20 days from the start of recovery operations to being recovered. Only 32% were recovered within two weeks and 28% took longer than six weeks. The full case, measured until the customer was content to close it, had a median of 26 days and 45% of cases stayed open for more than 30 days.
So what?
Cyber resilience is measured in recovery time, not only in whether recovery is possible. Knowing what happened is usually quick; returning to normal is not. Rehearse recovery end to end, including identity, applications and data. Measure how long it really takes and keep recovery points isolated, immutable and verified clean.
What to do: Five moves for security leaders
Key facts
- 16,953 publicly reported ransomware incidents analysed for January to October 2026; 100 groups active.
- Median time from the start of recovery operations to recovery was 20 days; 28% of recovery cases took longer than six weeks, while 68% of forensic findings arrived within 48 hours.
- Slip-through rate in backup telemetry: 21% of active groups, covering 62% of attributed public incidents; 9 of the 10 most active groups were seen, and 7 groups appear in all three lenses.
- 67% of incident reports with a stated tactic involved stolen data and 45% explicitly involved encryption; 13% reported both (minimums).
- 8 groups account for half of attributed incidents; Qilin alone accounts for 15%.
- Attackers attempted to log in to the backup management console in 7% of recovery cases (up to 14% allowing for unrecorded cases).
- Where the entry point is stated, 54% were exploited vulnerabilities, but 94% of public reports do not state one.
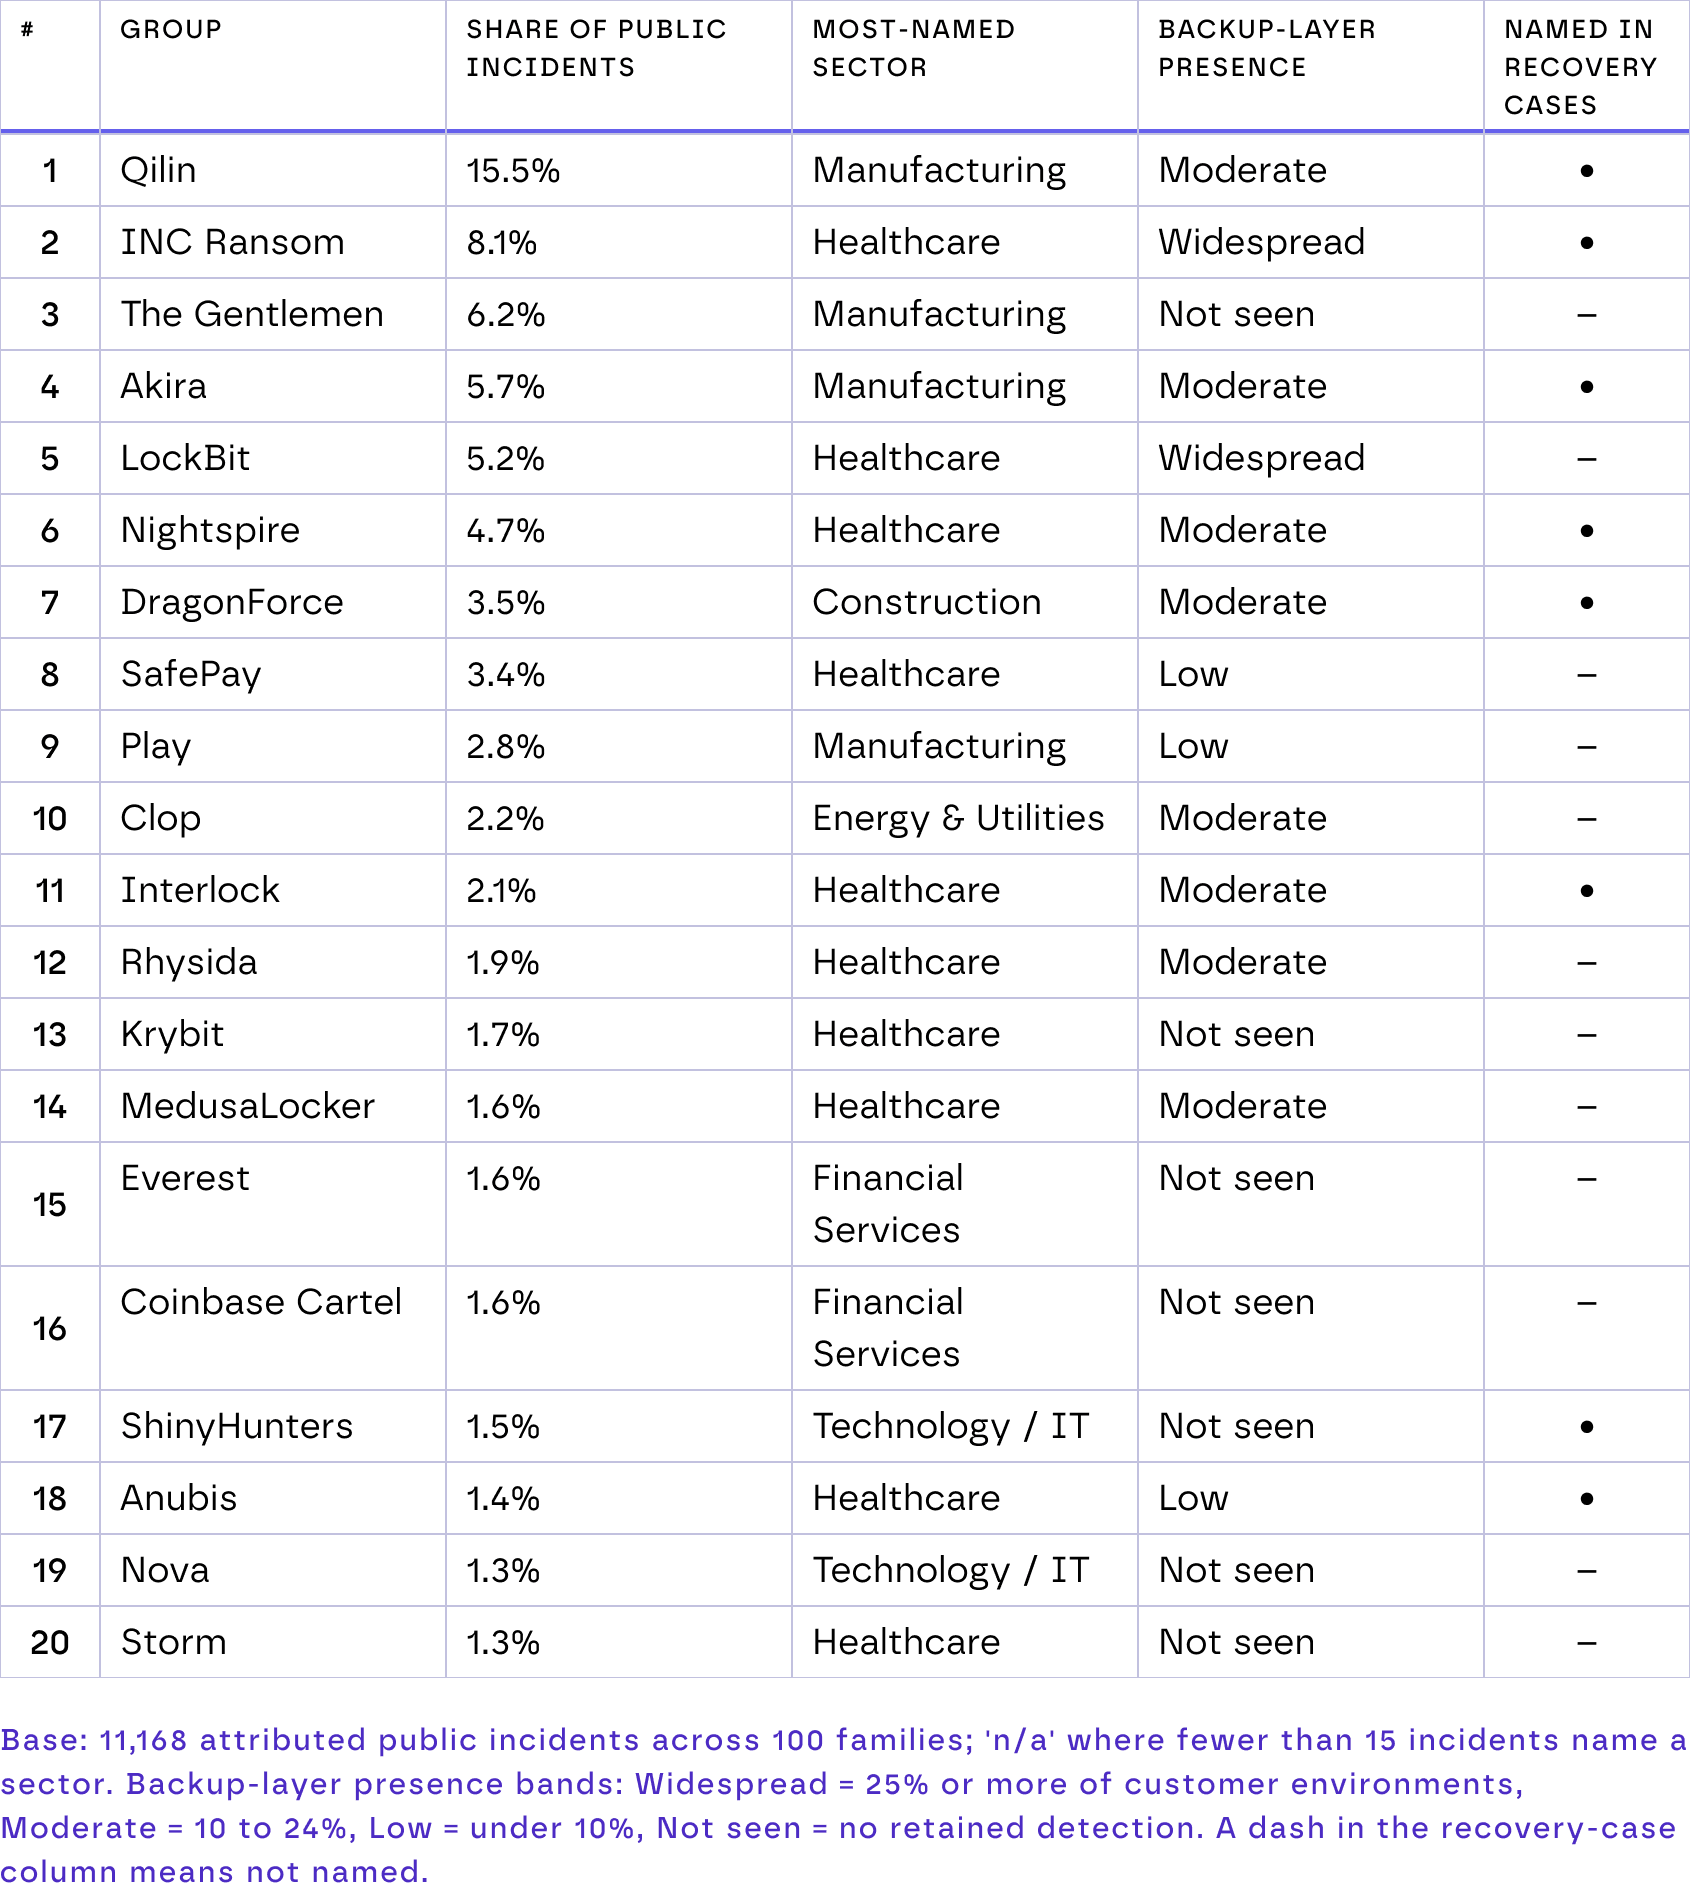
Appendix A: The twenty most active groups through three lenses
Appendix B: Data notes and definitions
Public reporting. 16,953 incident-level records from publicly available reporting and victim publications, January to October 2026, structured into fields such as group, sector, country, tactic and entry point. Duplicates were removed, names and aliases standardised, and aggregate statistics, historical cases and lifetime figures excluded.Victim listings show that a group named a victim; claims such as data volumes are the attackers' own. Fields are counted only where stated, so each chart shows its base.
Active and vetted groups. A group is active in 2026 when public reporting holds at least three attacker-published victim listings for it. Each of the 100 remaining names was individually checked against independent reporting; unconfirmed names, duplicate names and placeholders were excluded or merged. Families detected in telemetry without confirmed 2026 public activity are excluded.
Backup telemetry. Detections from scanning of backup data in customer environments, January to October 2026. Names were mapped to public group names by exact match, an alias table and the attribution text carried by the detection. A family generating an abnormal alert volume on one day was treated as a suspected false-positive burst and excluded in full, even where this removed some genuine detections.
Ransomware recovery engagements. Engagements handled in 2026 in which organisations that had been hit asked for help recovering the business, one record per unique customer account, with duplicates and false positives removed.